
Welcome to
Azur Electronics
Azur Electronics
OPERATING HP 1630D
TIMING MEASUREMENTS
TIMING MEASUREMENTS
Home
Projects
Test Equipment
- Accessories
- Adaptors
- Amplifiers
- Attenuators
- Cables
- Frequency Counters
- Logic Analysers
- Multi-Meters
- Network Analysers
- Oscilloscopes
- Power Meters
- Power Supplies
- Prototyping Equipment
- Signal Generators
- Spectrum Analysers
- Tools
Operating Information
- Operating HP 141T
- Operating HP 1630D
- Operating HP 8175A
- Operating HP 8407A
- Operating HP 8410C
- Operating HP 8552B IF Section
- Operating HP 8553B RF Section
- Operating HP 8554B RF Section
- Operating HP 8555A RF Section
- Operating HP 8556A LF Section
- Operating HP 8594E Spectrum Analyser
- Operating HP 8901B
- Operating LeCroy 9310
Technical
- Allen Key Sizes
- High Voltage Measurement
- HP Cases
- HP Information
- HP-IB Interface Bus
- Measurement Units
- Motorola ECL
- RF Connectors
- RF Power - Voltage Conversion
For Sale
Wanted
Links
About Me
Contact Me
Site Map
Set-Up
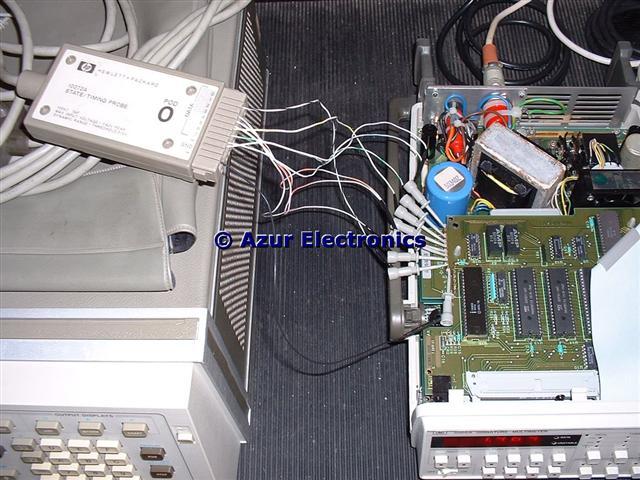
The Manual uses the HP 5036A Microprocessor Lab, which I do not have (yet), as a test bed. Instead I am using the microprocessor based HP 5005A Signature Multimeter. Pod O is connected to A3 Microprocessor Assembly test points: ALE, not WR, not RD, SCLK, CE3, CE2, CE1, A15 & GND. The 5005A is set to measure dc volts from a 10kHz square wave source.
The Manual uses the HP 5036A Microprocessor Lab, which I do not have (yet), as a test bed. Instead I am using the microprocessor based HP 5005A Signature Multimeter. Pod O is connected to A3 Microprocessor Assembly test points: ALE, not WR, not RD, SCLK, CE3, CE2, CE1, A15 & GND. The 5005A is set to measure dc volts from a 10kHz square wave source.
1630D & 5005A
Activating The Timing Analyser
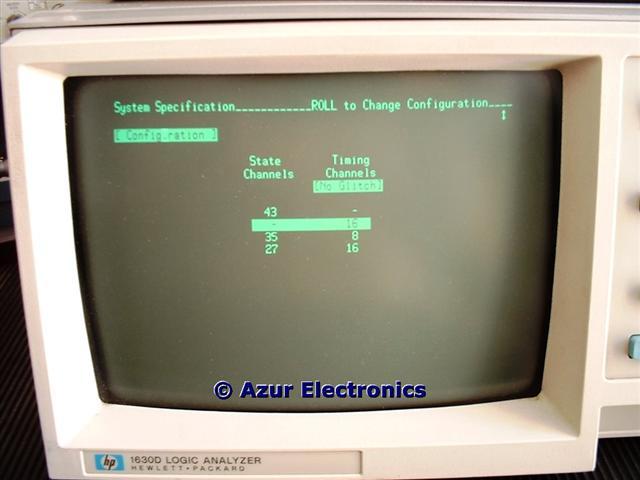
After power-up, press SYSTEM then use the CURSOR to select 16 Timing Channels. Note that 'Glitch Detection' is an option, but this halves the number of timing channels available to 8 or 4 instead of 16 or 8.
After power-up, press SYSTEM then use the CURSOR to select 16 Timing Channels. Note that 'Glitch Detection' is an option, but this halves the number of timing channels available to 8 or 4 instead of 16 or 8.
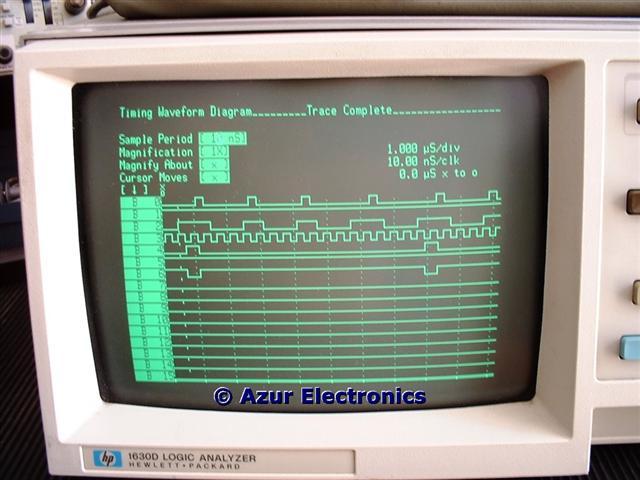
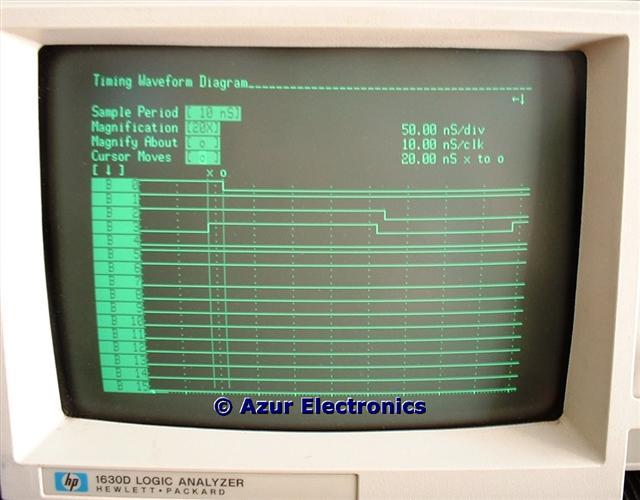
Press RUN for default waveform display.
Controlling The Timing Display
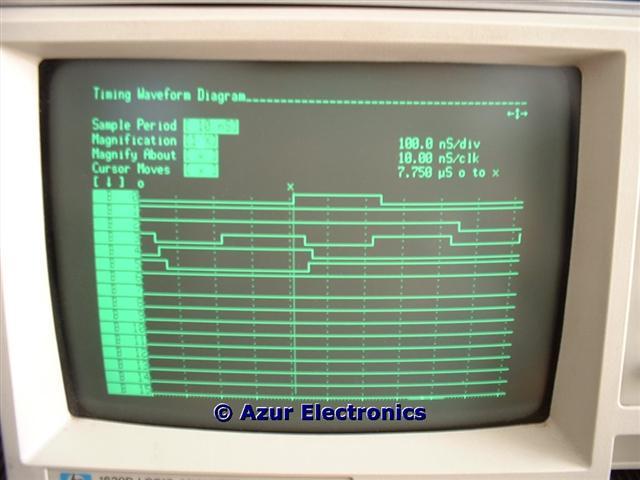
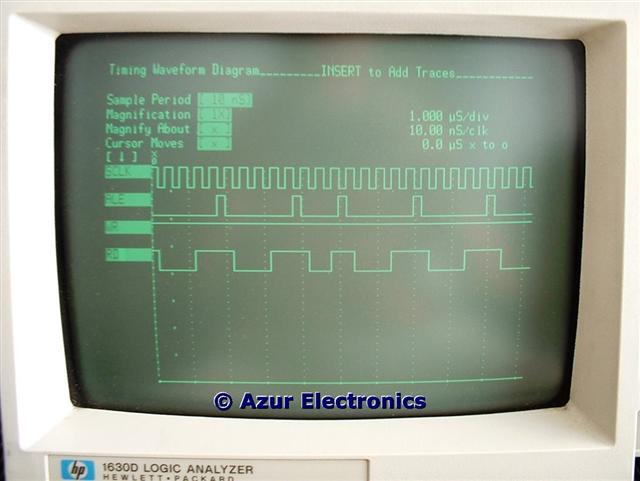
Sample period can be set as required. Cursor in the Magnification field and NEXT/PREV changes magnification factor. ROLL scrolls across the display.
Sample period can be set as required. Cursor in the Magnification field and NEXT/PREV changes magnification factor. ROLL scrolls across the display.
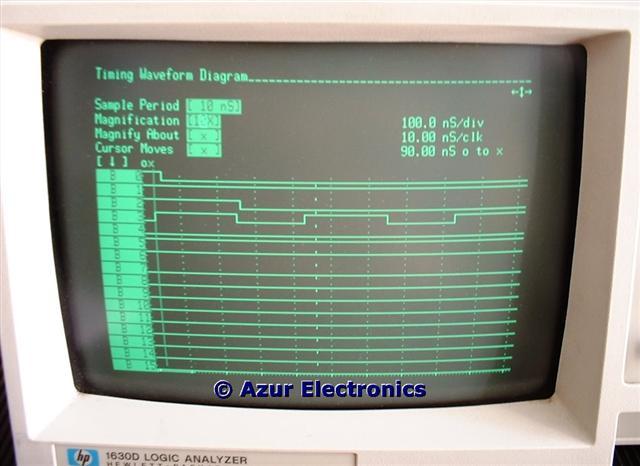
Right Cursor moves 'x' marker across the display and time measurement shown for start position 'o' to 'x'. Move to Cursor Moves field and NEXT will change marker to 'o'. Now Right Cursor moves 'o' marker across display and new time measurement shown between markers. Various magnification settings and positions can be utilised.
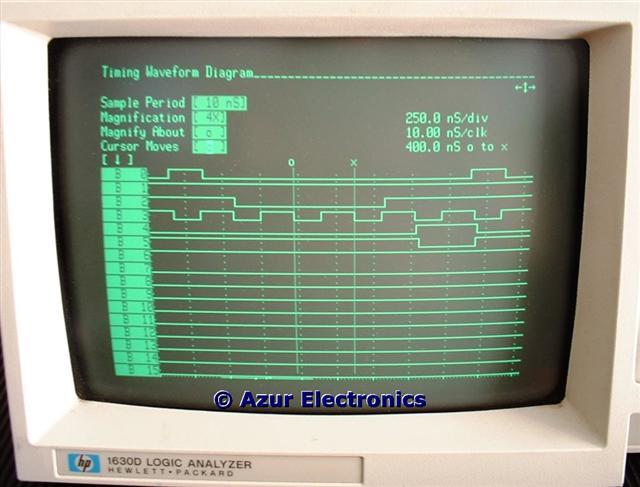
Move to Cursor Moves field and NEXT will change marker to 'x & o'. Now Right Cursor moves both markers together across display and fixed time measurement shown between markers. Various magnification settings and positions can be utilised.
Selecting Trace Positions On The Display
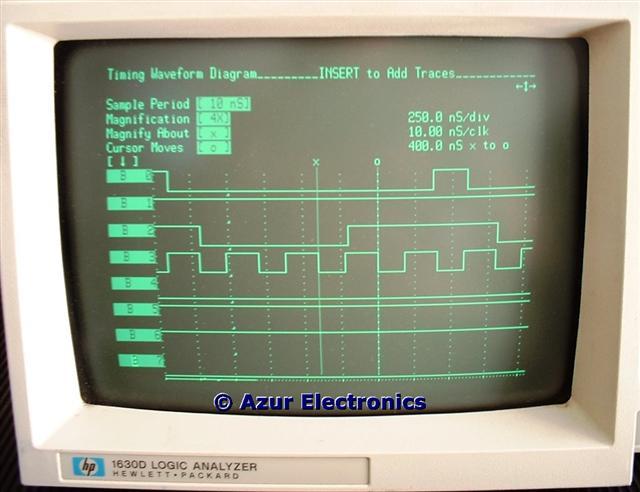
Move Cursor down to unused B field (normally B0 to B15 displayed). NEXT/PREV moves B fields up, down or off. DELETE removes fields. Display is magnified vertically if only 8 fields or less are left. INSERT adds more B fields. DEFAULT returns display to original state.
Move Cursor down to unused B field (normally B0 to B15 displayed). NEXT/PREV moves B fields up, down or off. DELETE removes fields. Display is magnified vertically if only 8 fields or less are left. INSERT adds more B fields. DEFAULT returns display to original state.
Triggering On A Timing Event
Use the 'x' cursor to find a condition, for example, where 2 channels are high (B2 & B4) and 1 channel has a low to high transition (B0).
Use the 'x' cursor to find a condition, for example, where 2 channels are high (B2 & B4) and 1 channel has a low to high transition (B0).
Magnify to check position of rising transition edge.
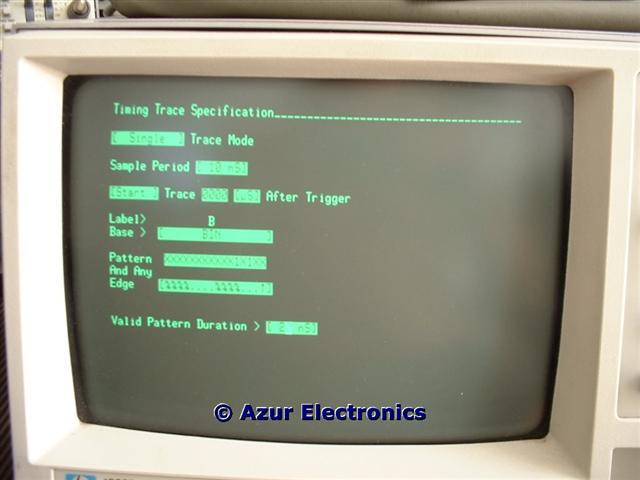
TRACE to enter menu. Set Pattern (AND) field to reflect required triggering condition. 0, 1 or X (don't care). B0 is the first bit on the right of the Pattern field. Set Edge (OR) field to reflect required trigger condition. N/A, ↑ (low to high), ↓ (high to low) or ↕ (both transitions). B0 is the first bit on the right of the Edge field. Edge recognition is not available for all the timing bits.
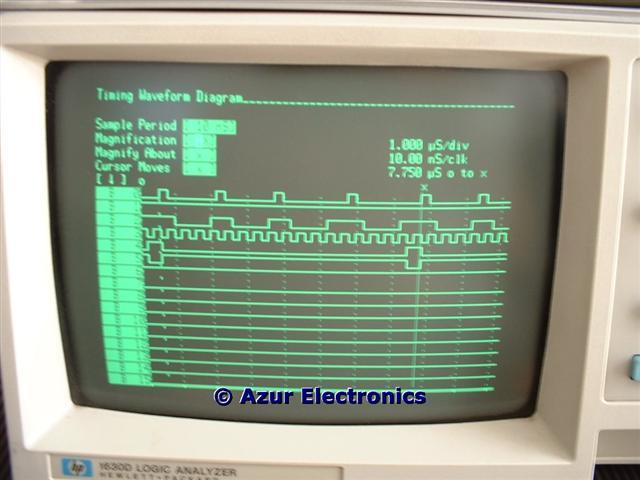
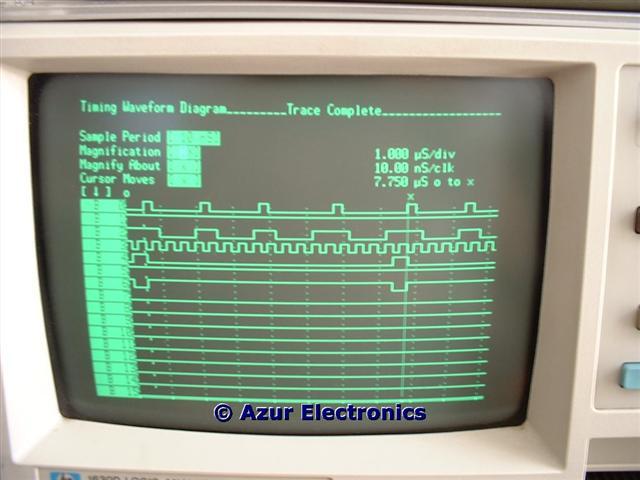
RUN will then search the data until it finds a clock period in which all the triggering conditions are met. This will trigger a trace and fill the Analyser's memory. The vertical marker displays the trigger point.
The Timing Format Specification
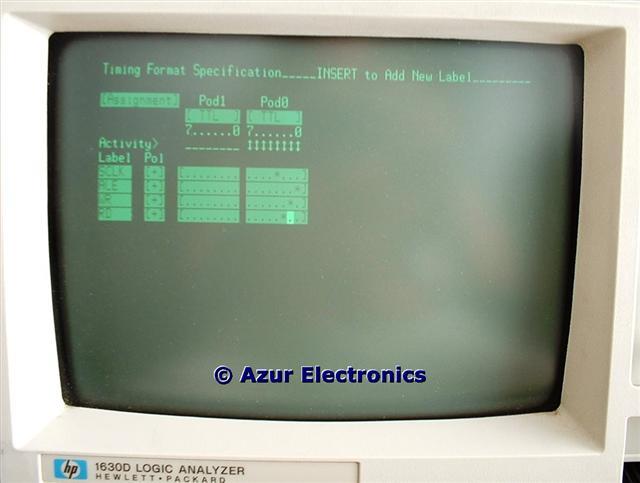
FORMAT enters the menu. This allows label and threshold assignments. The Pods can be individually set for TTL, ECL, or +9.9V to -9.9V in 0.1V increments, for threshold levels. So, for instance, one Pod could be used for TTL signals while another Pod is used for ECL signals.
FORMAT enters the menu. This allows label and threshold assignments. The Pods can be individually set for TTL, ECL, or +9.9V to -9.9V in 0.1V increments, for threshold levels. So, for instance, one Pod could be used for TTL signals while another Pod is used for ECL signals.
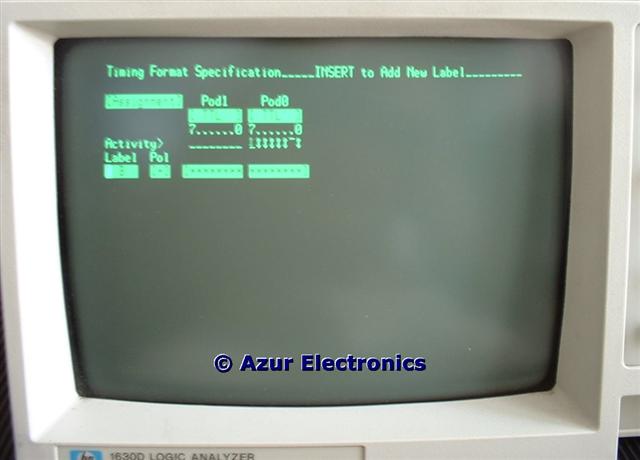
The 'Label Assignment' is a bit more tricky to implement and not very well explained in the Manual. Essentially, it is not very helpful to have a signal labeled B0 and the next signal B1, etc. Far more useful to have the actual signal name, ie. ALE, CLK, etc. The Activity Label can be changed to the desired signal name, 1 to 5 alphanumeric characters. The signal polarity can be +ve or -ve. The signal position on the Pod needs to be identified with an '*' all the other positions must be a '.' and B0 is the first bit on the right of the Pod field. The INSERT key adds another label to be identified. In this example 4 signals are identified with their respective positions on Pod 0. One problem is that with the 1630D, this setup data is not saved when powered-off, so it has to be re-entered each time (the 1630G can save the setup data).
Pressing RUN will display the first signal. Move the Cursor to the 1st signal field and press INSERT then NEXT to obtain the next signal and repeat as required.
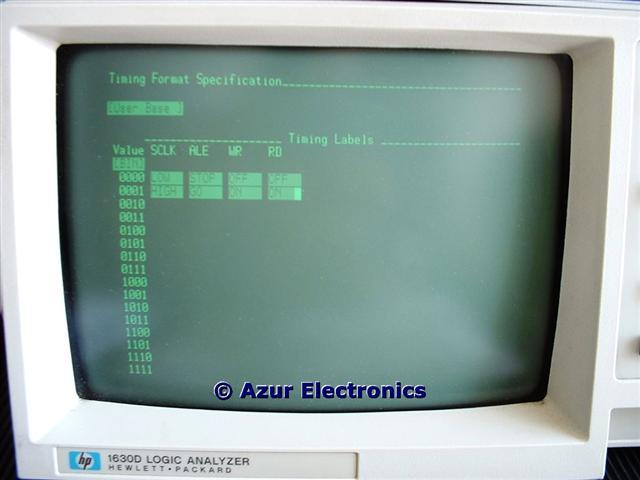
In the Timimg Format Menu, changing Assignments to User Base allows names to be dispayed in place of numbers when identifying states on labeled bits.
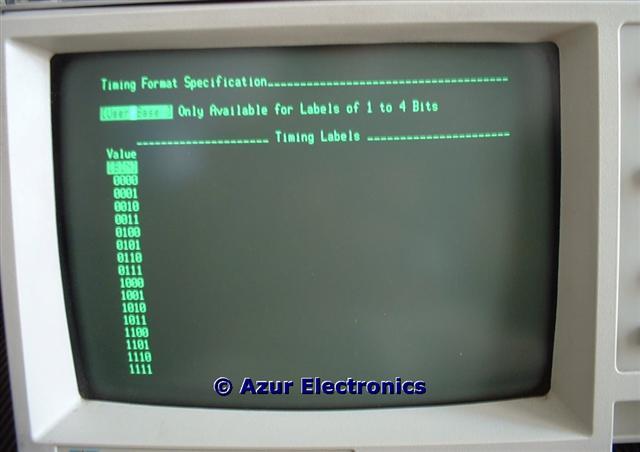
So with the previously identified 4 signals, names can be displayed in place of numbers when identifying states found on labeled bits. Up to 8 labels can be displayed on the menu. I have not yet found how to actually display this information on the WFORM screen, so some more investigation is required!
The Timing Trace Specification
TRACE enters the menu. Same menu as 'Triggering On A Timing Event' as above, this details more options for: single or continuous trace; sample period; start, centre or end trace at specified trace point delay in ns, µs, ms, s after trigger; base in binary, octal, decimal, hexadecimal, ascii; pattern and edge fields as above; duration of pattern must remain stable to be recognised as a trigger.
TRACE enters the menu. Same menu as 'Triggering On A Timing Event' as above, this details more options for: single or continuous trace; sample period; start, centre or end trace at specified trace point delay in ns, µs, ms, s after trigger; base in binary, octal, decimal, hexadecimal, ascii; pattern and edge fields as above; duration of pattern must remain stable to be recognised as a trigger.
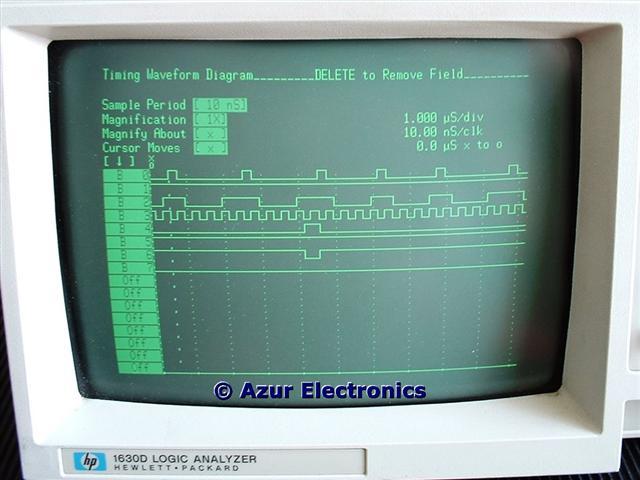
Waveform Displays
This is the standard display when RUN or WFORM is pressed.
This is the standard display when RUN or WFORM is pressed.
List Displays
This is only available when timing measurements are being carried out. Base in binary, octal, decimal, hexadecimal, or ascii. More explanation?
This is only available when timing measurements are being carried out. Base in binary, octal, decimal, hexadecimal, or ascii. More explanation?
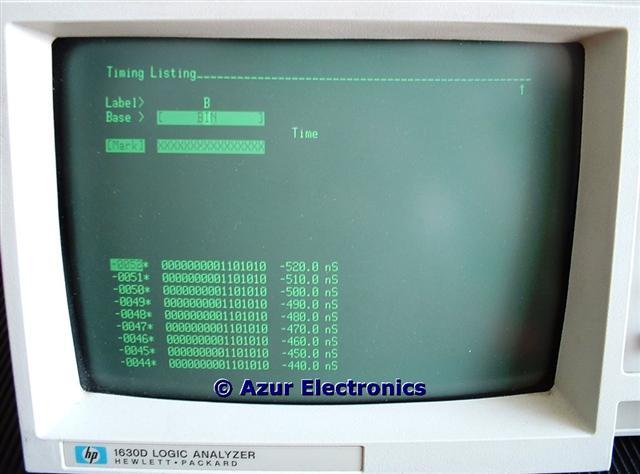
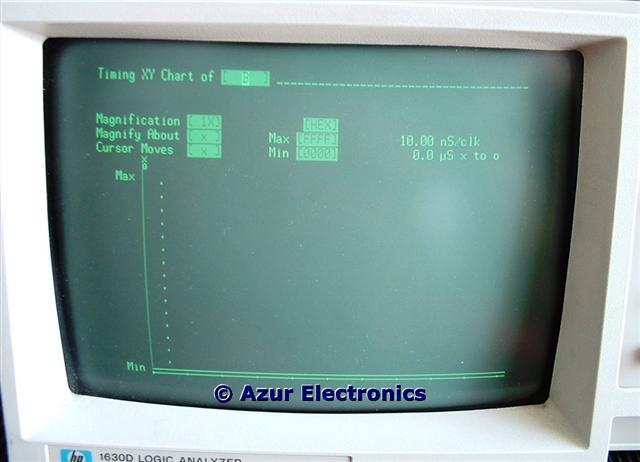
Chart Displays
The Analyser can format XY charts of the activity collected from any labeled set of bits to show patterns of activity. Josef has contributed the following:
The XY chart is very helpful to see in which address areas the CPU is currently working. You get an easy overview about access to EPROM, RAM, Zero-Page, Video-RAM, IO, etc. You can also see if areas are copied or moved with increasing or decreasing addresses.
To get the best out of the 1630D it is essential to read the Operating and Programming Manual, there are many more facilities available.